The National Accounts Section of the Department of Statistics announces the release of the estimates of Gross Domestic Product (GDP) for the period 2008 to 2012. The 2012 figures are Preliminary, 2011 are Provisional, 2010 and 2009 are Revised and the 2008 are Final until the next historical revision.
The 2012 annual preliminary results are based on early estimates from major data sources such as the Central Bank, Ministry of Tourism, and the Foreign Trade Section of the Department of Statistics, etc. They are also based on indicators which normally mimic movements of particular industries such as Hotel Room Rates, Megawatt Sales, Building Permits, Chargeable Telephone Minutes, Consumer Price Index, etc. The 2012 GDP figures are Preliminary and will be revised as more data become available.
The GDP is measured in both Current Market Prices and Constant 2006 Prices. The current measure utilizes current price levels and currency values, without factoring in inflation and determines the total value of the products and services produced in a particular year. The Constant Prices measures the effects of inflation and is more useful for studying trends in economic growth.
According to the preliminary results, the GDP in Current Prices for 2012 had a positive growth of 3.5%, while GDP in Constant Prices grew at 1.83%.
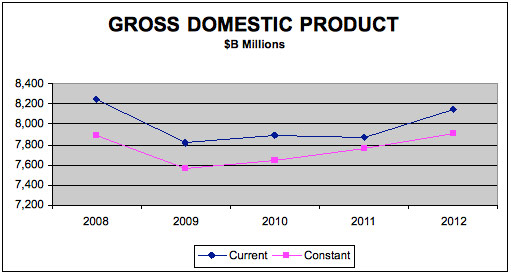
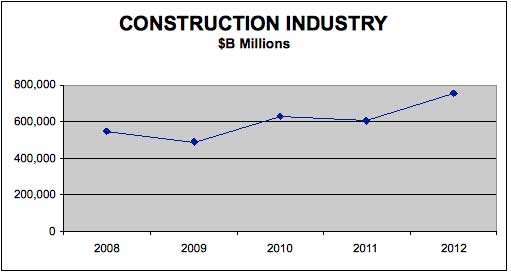
The growth at constant prices was due to increases in the Construction Industry, Manufacturing, Hotel Industry and Marine Transport In contrast, Fisheries, Electricity, Mining, Banking, Insurance and Real Estate/Gross Rents declined.
The Expenditure Approach to GDP is through measurement of Government and Household Consumption combined with Investment and Exports minus Imports. The Exports of Goods and Services at Constant Prices in 2012 grew by 5.7% and in Current Prices, 6.4%, a direct result of an 11% increase in the Export of Goods. Tourism expenditure which increased by 5% together with an infusion of 18% in Local Expenses of the Off Shore Companies were the main contributors to the increase in The Export of Services
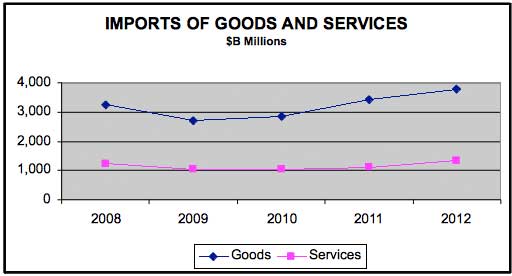
Imports of Goods and Services at Constant Prices in 2012 grew by 13%. The Imports of Goods which represent 74% of all Imports grew by 16.7%, led mainly by significant increases in Machinery and Transport Equipment and Manufactured Goods Classified Chiefly by Materials. The Imports of Construction Services which increased by 92% was the major catalyst for the 10% overall increase in the Imports of Services.
Gross Capital Formation measures the value of Investment in Buildings, Machinery and Infra-structure in the economy and is a combination of the materials and labour that are utilized to produce the various projects. The Gross Capital Formation in Constant Prices grew by 20.6%. The impetus in this sector was Non-Residential Construction and Machinery and Transport Equipment which increased by 97% and 22.6%, respectively. This build-up of these fixed assets was the direct result of major capital projects such as the BahaMar and the Airport Expansion Projects, etc.
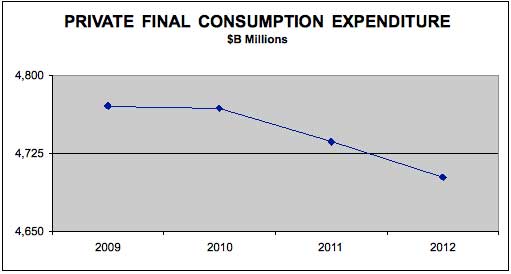
The Private Final Consumption Expenditure (PFCE) or Household Expenditure which represents 70% of the GDP, increased in Current Prices by 2.9%. This increase was mostly in the Wholesale and Retail Trade Industry which grew by 5%, and Household Expenditure Abroad which grew by 20%. Contrary to the overall PFCE current growth, a slight decrease was measured at Constant Prices, where PFCE declined by 0.7% as part of the constant growth was mainly due to the increased prices. This decline is due to the All Items NP Consumer Price Index used to deflate the PFCE, which moved from 135.5 in 2011 to 138.4 in 2012.
The Government Final Consumption Expenditure (GFCE) is measured as Compensation of Employees, Depreciation Expense and Intermediate Consumption. This GFCE is split between Individual Consumption and Collective Consumption. In 2012, The Individual Consumption which includes Health and Education grew by 1.6% at Constant Prices and the Collective Consumption, which represents the remaining services, experienced a 2.5% growth.
A National Accounts 2012 Report with detailed tables will be available at the end of April 2013 on the Department’s website, http://statistics.bahamas.gov.bs.

